Few topics in the fruit and vegetable sector are more confusing than the sustainability of packaging. Should packaging be used or not? What is the best material? Paper, cardboard, bioplastic, or ‘just’ plastic? There are many options and opinions with little concrete information. What to choose? Alies Padding, Innovations Manager, and Marcel Pouw, Communications Manager at NNZ, have also noticed their clients’ struggle with this packaging issue.

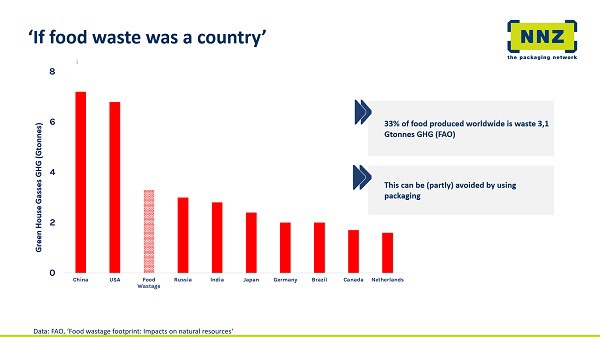
This multinational company offers a wide range of packaging to the fruit and vegetable, and the industrial sector. “We see that our fruit and vegetable clients are looking for the best sustainable packaging solutions,” says Alies. That is why, using their Future Route method, NNZ gives clients insight into the sustainability of different aspects. It then becomes clear how, when it comes to food wastage, clients can deal with packaging. And figures show that a substantial amount of food is being wasted. The FAO (ref. 1) shows that about 33% of globally produced food is lost.
If that, combined with CO2 emissions, was a country, it would be the third-largest. That is after China and the United States, but ahead of Russia. “That can be partially prevented by using packaging,” explains Alies. The Future Route method was introduced at FruitLogistica and was well-received by clients and retailers. “The method’s strength is that we give our clients insight. Based on that knowledge, clients know how to implement their sustainability strategies,” adds Marcel.

Packaging is functional
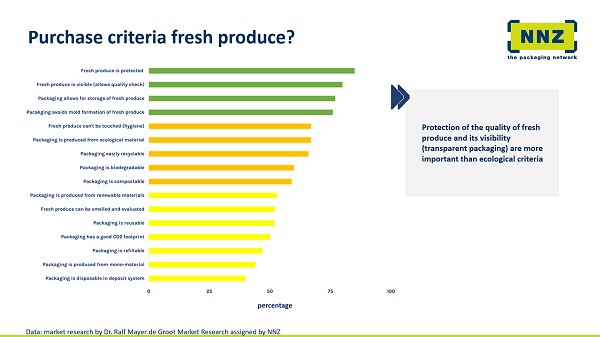
When NNZ speaks to its clients about package sustainability, the packaging’s function is the starting point, says Alies. NNZ thinks packaging’s primary purpose is to protect its content. It is instrumental in preventing food wastage. “In the supply chain, packaging is often needed for transportation, protection, storage, and marketing.” Future Route then uses figures to urge clients to reevaluate their packaging choices. Future Route offers insight into various packaging options’ environmental impact, costs, market acceptance, and food wastage.
Alies admits the packaging’s footprint, based on its specifications, is calculated for NNZ by a Dutch external party - Greenhouse Marketeers. With the packaging material’s environmental impact, aspects like CO2 emissions, water, and energy usage, and the material’s recyclability, are considered. The second factor is the cost. Here, research is done into its cost for nature, the packaging itself’s and the packaging machines' cost. With market acceptance, branding, product information, and a communication medium’s importance are looked at.
“When it comes to market acceptance, transparent, responsible communication with customers is important. The consumer must understand why our client made a certain choice.” Finally, the food wastage factor is considered. Ultimately, the client chooses a packaging that suits their company’s sustainability strategy. This choice is based on the figures that emerge from research into these different factors. “The clients, themselves, determine how much weight to place on environmental impact, costs, and market acceptance in their package choice,” concludes Marcel.

Packaging or wastage
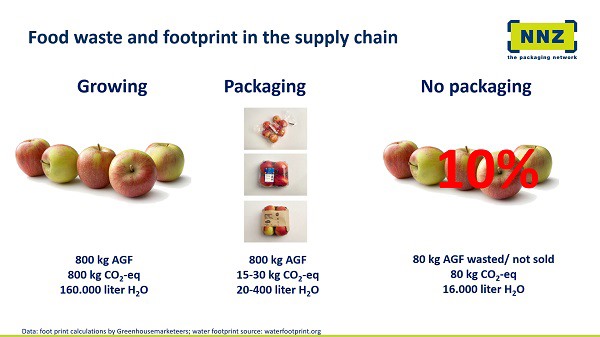
Producing one kg of fruit and vegetables is associated, on average, with one kg of CO2 emissions and the use of 220 liters of water (ref. 2). Using apples as an example, Alies Padding demonstrates that its packaging can contribute to lowering its total CO2 emissions and water usage. Cultivating 800kg of apples emits 800kg of CO2 and 160,000 liters of water. Packaging that same 800kg of apples needs 1,000 packs per four pieces of fruit.
The production of this packaging is associated with CO2 emissions of 15 to 30kg and water usage of between 20 and 400 liters. “Suppose that, with unpackaged apples, a ten percent wastage has to be considered. That equates to 80kg of apples that are lost or unsold because they were not sufficiently protected. In that case, 80 kg of CO2 and 16,000 liters of water is wasted. That, while the packaging’s environmental impact is only a fraction of that.”
Ref.1: FAO, ‘Food wastage footprint. Impacts on natural resources. Summary Report’. GHG data from UNFCCC.
Ref.2: Mekonnen, M.M. and Hoekstra, A.Y. (2010) The green, blue and grey water footprint of crops and derived crop products, Value of Water Research Report Series No. 47, UNESCO-IHE, Delft, the Netherlands.
More information: NNZ
NNZ
1 Aarhusweg
9723 JJ Groningen, NL
Tel: +31 (0) 505 207 800
info@nnz.nl
www.nnz.nl
Alies Padding
a.padding@nnz.nl
Marcel Pouw
mpouw@nnz.nl
