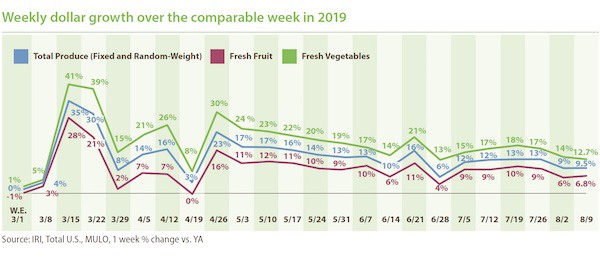
The second full week of August was the fifth of eight non-holiday weeks between Independence Day and Labor Day, in which everyday demand alone had to drive the sales performance. Consumer concern over the COVID-19 pandemic remained highly elevated and several severe weather events rendered many households along the eastern seaboard and Iowa without power.
The net result for fresh produce was an increase of 9.5% over year ago during the week ending August 9 — stable over the prior week and on par with the total store trend of 9.4%. Frozen and shelf-stable fruits and vegetables had higher percentage gains but off a smaller base, with particular strength for frozen, at +20.2%. Year-to-date through August, fresh produce department sales are up 11.1% over the same time period in 2019. Frozen fruit and vegetables increased the most, up 27.4% year-to-date.
- Fresh produce increased +9.5% over the comparable week in 2019.
- Frozen, +20.2%
- Shelf-stable, +13.9%
Source: IRI, Total US, MULO, 1 week % dollar growth vs. year ago
“Economic pressure tends to have big impacts on grocery shopping, including channel choice, the type of items and quantity bought, the importance of price and promotions and more,” said Joe Watson, VP of Membership and Engagement for the Produce Marketing Association (PMA). “During the next few weeks and months, it will be important to highlight the great value of fresh produce and home cooking. At the same time, consumers appreciate help with recipe ideas and meal planning as that is an increasing area of struggle. We will also keep an eye on back-to-school that will look very differently this year, which will once more impact year-over-year trending.”
Fresh Produce
Fresh produce generated $1.35 billion in sales the week ending August 9 — an additional $117 million in fresh produce sales over the prior year. This is below the pandemic average for additional dollars, at $177 million per week, as everyday demand continues to see a bit of a slow erosion week to week.
“During the week of August 9, we saw a strong performance of summer fruits and the smallest performance gap between fruit and vegetables we have seen in a long time,” said Watson. Fruit’s pandemic performance has been a bit more up and down than vegetables. The growth rate for fresh fruit increased versus the prior week level, at +6.8%.
Vegetable gains, while 12.7% ahead of last year, saw the lowest increase since the start of the pandemic sales patterns in mid March, with the exception of the week ending April 19, which went up against the Easter 2019 sales numbers.

Fresh Share
The fresh produce share of total fruit and vegetable sales across all three temperature zones remained at 82% during the week ending August 9. After falling to as low as 70% of total fruit and vegetable dollars across temperature zones, the fresh share had made a full comeback to its typical 84% during Independence Day week. However, as COVID-19 cases started to rise again, the fresh share has fallen back down to 82%, with above-average strength for frozen fruit and vegetable sales.

Fresh Produce Dollars versus Volume
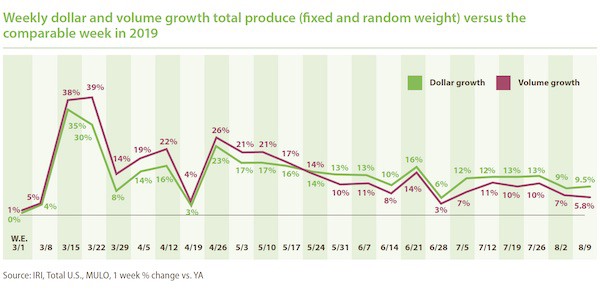
Dollar gains continued to track ahead of volume gains ever since the week of May 24. But while dollar gains for total produce increased, volume gains decreased — leaving a wider gap. For total produce, dollars tracked 2.6 percentage points ahead of volume the week of August 2nd and 3.7 points the week ending August 9 — pointing to slightly higher inflationary pressure than we have been seeing. Additionally, the total department view is a bit misleading with many areas seeing double-digit inflation or deflation.

Both fruit and vegetables saw dollar sales gains track ahead of volume gains, but the gap was significantly larger for fruit. Fruit volume gained 2.7% over the same week last year, showing demand is up but not quite keeping pace with other foods. Vegetable volume growth remained in double digits during the week ending August 9.

While overall produce inflation was relatively mild at +3.5% versus 2019, supply and demand continue to be out of sync in many areas, causing double digit gaps in dollar gains and volume gains in either direction. Ample supply drove double-digit deflation for items such as pomegranates, avocados and plums. On the other hand, dollar gains far outpaced volume due to double-digit inflation for items such as mangoes, berries and cucumbers. This was the first in many weeks that both corn and cherries were back in single-digit, year-over-year inflation.

To read the full report, click here.
 For more information:
Anne-Marie Roerink
210 Analytics LLC
Tel: +1 (210) 651-2719
Email: [email protected]
www.210analytics.com


