Five months after two of the biggest weeks in the history of food retailing, consumer demand for fresh, frozen and center-store food and beverages continues to ride well above the 2019 baseline. The week ending August 16 was the sixth of eight non-holiday weeks between Independence Day and Labor Day and everyday demand easily exceeded year ago levels across departments. New COVID-19 cases started to moderate in many states and the federal unemployment benefit that expired at the end of July was extended, albeit at a lower amount than previously.
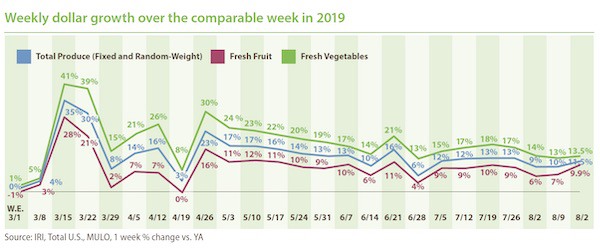
Between January and August 16, produce sales in calendar year 2020 are $4.5 billion ahead of 2019 sales, with an additional 2.9 billion pounds of fresh produce sold. Fresh produce appears to be settling into an everyday demand pattern that sits about 10% above last year’s levels. For the week of August 16, fresh fruit and vegetable sales increased 11.5% over 2019 — jumping back into double-digit increases.
- Fresh produce increased +11.5% over the comparable week in 2019.
- Frozen, +20.9%
- Shelf-stable, +10.8%
Source: IRI, Total US, MULO, 1 week % dollar growth vs. year ago
Fresh Produce
Fresh produce generated $1.34 billion in sales the week ending August 16 — an additional $139 million in fresh produce sales over the prior year. This is below the pandemic average for additional dollars, at $176 million per week, as everyday demand continues to see a bit of a slow erosion week to week.

“During the week of August 16, we saw a strong performance of summer fruits and the smallest performance gap between fruit and vegetables we have seen in a long time, at just 3.6 percentage points,” said Jonna Parker, Team Lead Fresh for IRI.
Fresh Share
The fresh produce share of total fruit and vegetable sales across all three temperature zones was 81.9% during the week ending August 16. After falling to as low as 70% of total fruit and vegetable dollars across temperature zones, the fresh share had made a full comeback to its typical 84% during Independence Day week — a big week for fresh produce. “

Fresh Produce Dollars versus Volume
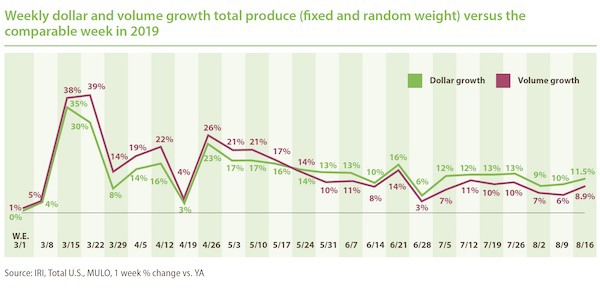
Ever since the week of May 24th, dollar gains have outpaced volume gains and the week of August 16 was no exception. This week had strong volume gains, closing the volume/dollar gap to just 2.6 percentage points overall. However, inflation and deflation across categories are balancing each other out for the total department view, and at the category level, substantial gaps remain.

Both fruit and vegetables saw dollar sales gains track ahead of volume gains. Fruit volume gains were significantly higher than those seen the past few weeks, at +7.3% over the same week last year. Vegetable volume growth remained in double digits during the week ending August 16.

While overall produce inflation was relatively mild at +2.4% versus 2019, supply and demand imbalance caused double digit gaps in dollar gains and volume gains in either direction. Ample supply drove double-digit deflation for items such as pomegranates, avocados and pineapples. On the other hand, dollar gains far outpaced volume due to double-digit inflation for items such as apricots, mangoes and berries.

Absolute Dollar Gains
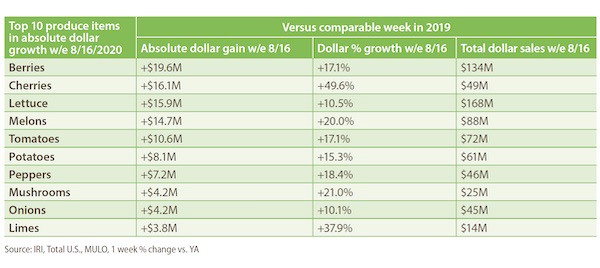
During the week of August 16, berries became the new number one in terms of absolute dollar gains versus the same week a year ago. The top 10 in absolute dollar gains completely changed from the week prior yet again. Taking over from cherries, berries contributed $19.6 million in new sales versus year ago as the number one in absolute dollar gains. Cherries dropped to second with a gain of $16.1 million. Lettuce was third with an additional $15.9 million. “

To read the full report, click here.
 For more information:
Anne-Marie Roerink
210 Analytics LLC
Tel: +1 (210) 651-2719
Email: aroerink@210analytics.com
www.210analytics.com
