Food prices affect household budgets, food choices, and diet quality. Food price data help to monitor food price inflation and study the dynamics between food prices and consumer purchasing decisions. The USDA, Economic Research Service's newly released Food-at-Home Monthly Area Prices (F-MAP) data product provides monthly food prices for 90 food groups across 15 geographic areas of the United States. It can be used to understand variability in food prices over time, by food product type, and across areas. The currently available data cover 2012 through 2018.
Food price measurements: unit values and price indexes
There are different ways to measure prices and price changes. Unit values (such as average prices) are a per-quantity value, and average prices are calculated by dividing total sales by total quantity. A unit price can be calculated as a price per item (for example, price per apple) or price per standardized weight (such as price per pound). Another common price measure is a price index, which is a unitless measure that tracks the cost of a basket, or assortment, of goods. The official Government measure of consumer inflation—the Consumer Price Index published by the U.S. Department of Labor, Bureau of Labor Statistics—is a price index. Unit prices show prices faced by consumers at a point in time, and price indexes typically are preferred for measuring price change over time and for consistent comparisons across geographic areas. Unit prices can be influenced by changes in the product mix or quality differences among items, which may obscure the effects of price changes. Price indexes, on the other hand, explicitly account for these changes in their formulas. The F-MAP contains both measurements—unit prices (average price per 100 grams) and price indexes—for each month, food group, and geographic area combination.
Monthly data enable seasonal food price analyses
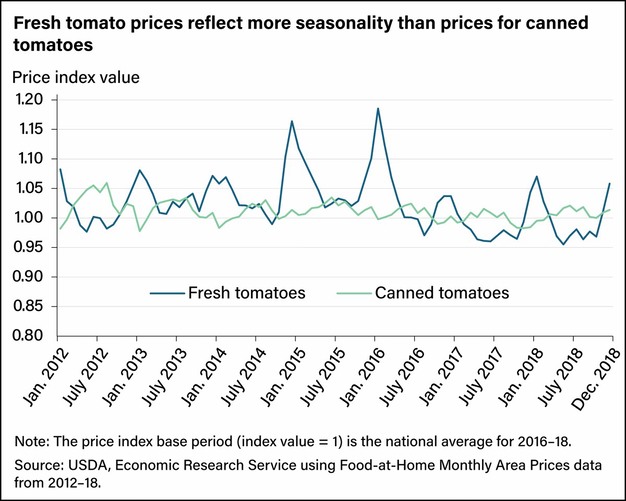
Prices for many food groups fluctuate throughout the year depending on seasonal shifts in supply and demand. The F-MAP reports unit prices and price indexes at the monthly level, which allows analysis of seasonal fluctuations. Seasonality is especially common for fresh produce, which is perishable and typically experiences more seasonal price variation than produce whose shelf life is extended through processes such as canning, freezing, or drying. The chart below shows patterns in national prices for fresh and canned tomatoes from 2012 to 2018. Prices for fresh tomatoes are generally higher during the winter and lower throughout the spring and summer, when tomatoes are in season domestically, while canned tomatoes show less seasonal price variation over the year.

Food price differences across geographic areas
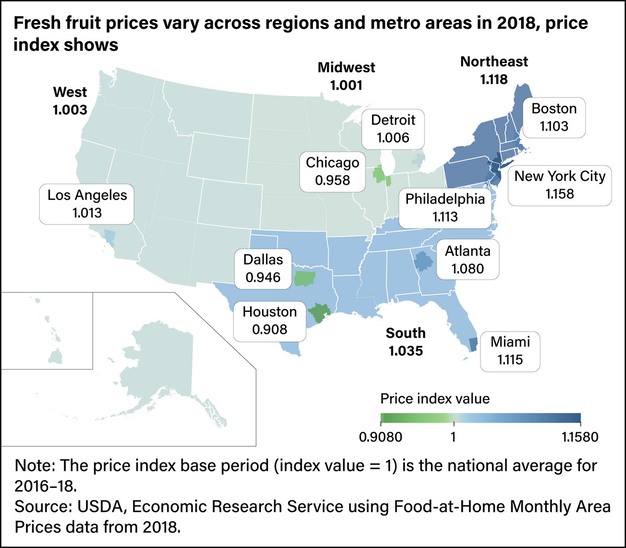
The F-MAP also reports unit prices and price indexes across 15 geographies, including four Census regions, ten major metropolitan areas, and nationally for the entire United States. Differences in regional food availability, consumer purchasing patterns, and variation in costs such as transportation, retailing, and labor can contribute to differences in food prices across areas. The unit prices in the F-MAP represent the average price across all items in a food group, weighted by the relative sales of foods in the group in each region or metro area. Product offerings can vary significantly across areas, and price changes based on the unit prices are not directly comparable across areas because they are based on different baskets of foods in each market. For example, the assortment of fresh fruits sold in Miami may differ from that in Chicago because of differences in availability and consumer demand. The F-MAP price index, in contrast, compares the price of a similar basket of foods across areas to form a comparable set of prices. The map below shows how prices for fresh whole fruits vary geographically based on the F-MAP price index. Prices for fresh fruits were highest across the New York City, Miami, and Philadelphia metro areas and in the Northeast region. Prices were lowest in the Houston, Dallas, and Chicago metro areas and in the Midwest and West regions.

Food price trends
Price changes calculated using price indexes typically are represented as a percent change in the index value relative to a base period. These may include the one-month change (such as January 2018 to February 2018), 12-month change (such as January 2017 to January 2018), or average annual price change (such as 2017 to 2018). Although food prices typically increase over time on average, price changes vary among food groups. For example, from 2012 to 2018, national annual average food prices increased as a whole. However, the chart below shows three examples of food product categories—fresh cut fruit, fresh fish and seafood, and unsweetened coffee and tea—with wide variation among prices for specific groups. During that time, prices rose on average 4.1 percent per year for fresh cut fruit and 2.9 percent for fresh fish and seafood but fell 1.8 percent for unsweetened coffee and tea.
For more information:
USDA
Email: press@usda.gov
www.usda.gov
