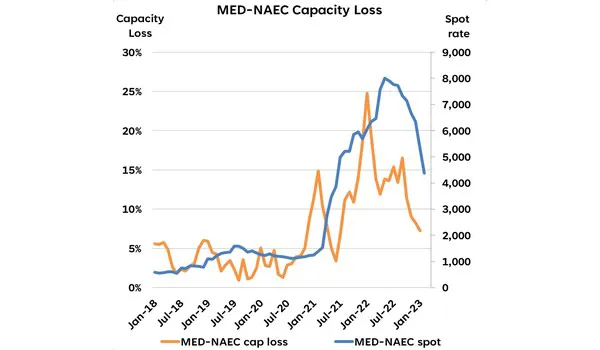
While the pandemic challenges were initiated by an exceptionally large growth in demand, the real challenge came as this high demand growth clogged up the hinterlands, which in turn clogged up the ports, which in turn led to unprecedented levels of vessel congestion. When vessels don’t move, they do not contribute to deployed capacity, and the capacity of the non-sailing vessels effectively become a loss of supply. This loss of supply became a greater factor in the supply/demand imbalance, than the demand growth that initiated it.
On a global level however, we have seen a reversal of capacity loss over the past year as vessel congestion has eased. With the latest measure of 6.2% capacity loss in January 2023, we are now roughly 2/3 of the way back to a normality of 2.2% from the peak in January 2022. In the last two months though, we have seen a reversal i.e., an increase in capacity loss. However, this could very well be a seasonal impact from inclement weather.
What is interesting here is that both the Transpacific and Asia-Europe trades show a strong correlation between capacity loss and spot rates, but the Transatlantic trade does not. At their respective peaks (capacity loss and spot rates), we see a 5-month time lag as shown in the figure above, which has now increased to 9-10 months.
Furthermore, the spot rates are still considerably above pre-pandemic levels. Not only that, the spot rate increase was also delayed compared to on the Transpacific and Asia-Europe trade lanes. This is also true for the other Transatlantic trade i.e., North Europe-North America East Coast. This is a strong indication that there are other drivers than supply and demand impacting freight rates on the Transatlantic trade.
For more information: sea-intelligence.com

