On an annualized basis against 2019, the rate of contraction for laden imports across the major North America West Coast ports declined in March 2023. While this could very well be a temporary easing up, it could also be an indication of normalizing market conditions.
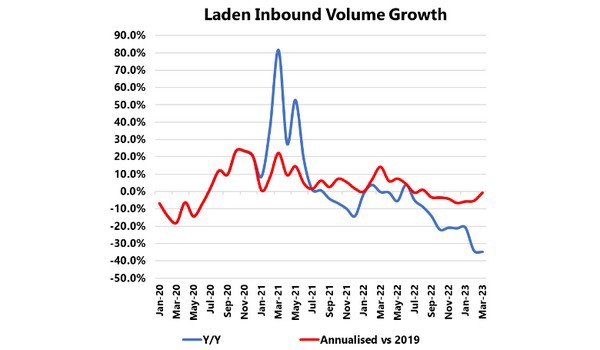
The figure below shows the laden inbound volume growth from January 2020 to March 2023. While the Y/Y growth (blue line) looks very bad in terms of a substantial volume contraction, we have to keep in mind that due to the volatile nature of demand in the last two years, a Y/Y comparison will inadvertently lead to a distorted analysis, as the relatively high demand growth in the same months in 2022 would mean that any growth under that level, even if it is in line with the pre-Covid baseline, would seem like a significant volume contraction.
This is why we include the annualized figure, which shows that the contraction for laden imports has been relatively stable in January and February 2023 at around -5.5%, with the March figure improving by a larger degree to -0.7%. The same trend can also be seen for the total handled volumes, with a peak contraction of -5.0% reached in February 2023, with March seeing some reprieve, as the strength of the contraction eased up to -2.2% instead. As mentioned at the start, this could be temporary, or it could also be an indication that we are heading towards market normalization.
What is more concerning, however, is empty exports have now started to contract, but the rate of contraction for laden exports has not eased up. The most likely explanation is that these volumes are being exported through the East Coast, which could result in a potential loss of volumes for the West Coast.
For more information:
Alan Murphy
Sea-Intelligence
[email protected]
am@sea‑intelligence.com
[email protected]
sea-intelligence.com

